In this article we will analyse the results generated by Jmeter. Since, Jmeter Summary Report listener covers almost all the necessary things required for performance analysis, I will be using it as an example for Jmeter results analysis.
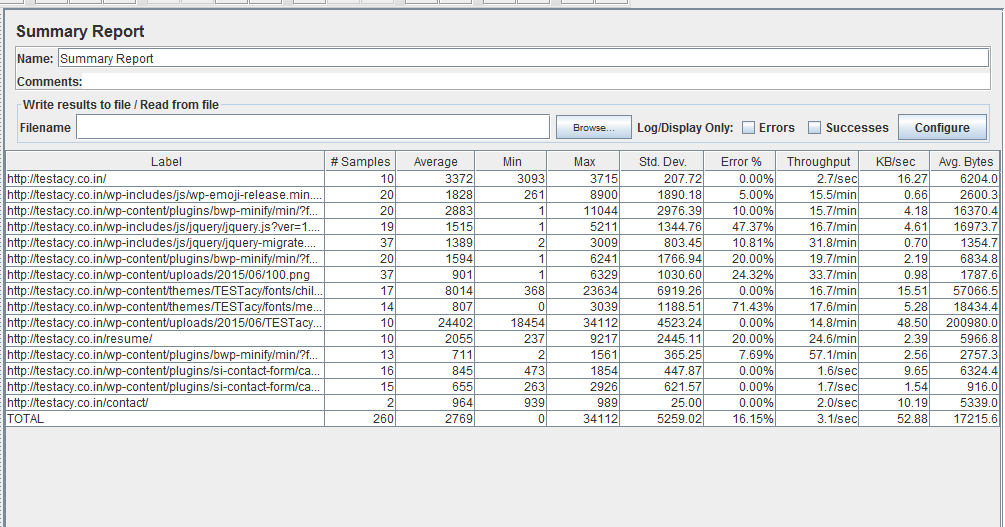
The above image shows a sample report generated by Jmeter. Now, I will explain what each column in the report contains;/
Label: Label lists the URL of the HTTP(s) request being made by Jmeter. That is, the URL listed in this column will be requested for the given number of virtual users.
Samples: Samples are the number of virtual users trying to access a
particular URL or HTTP(s) request simultaneously. Samples are calculated as shown
below,
Virtual Users = 10
HTTP(s) request = 1
Samples = 10 * 1 = 10
If a same label or HTTP(s) request is requested multiple times, then the number of
samples multiplies accordingly. For example,
Virtual Users = 10
HTTP(s) request = 2
Samples = 10 * 1 = 20
That is, the request goes through 2 times for each virtual user because the same URL is being called or requested twice.
Average: It is the average time taken by all the samples to execute the particular HTTP(s) request.
Min: The shortest time taken by a sample or virtual user to successfully execute the label or HTTP(s) request from the group of samples.
Max: The Longest time taken by a sample or virtual user to successfully execute the label or HTTP(s) request from the group of samples.
Standard Deviation: Knowing the standard deviation of your data set tells you how densely the data points are clustered around the mean. Simply put, the smaller the standard deviation, the more consistent the data. Standard deviation should be less than or equal to half of the average time for a label. If it is more than that, then it means that something is wrong. you need to figure out the problem and fix it.
Error %: Error % shows the percentage of failed requests per 100 requests made. This means the said percentage of requests have not been able to complete successfully.
Throughput: Throughput displays the efficiency of the server and
application to execute the HTTP(s) request for given number of users. It shows the
average number of successful requests per unit time. Throughput in Jmeter results is
calculated as per the given formula below,
Throughput = 1/{average bytes * [1/(KB/sec)]}
KB/Sec: KB/Sec is the throughput measured in Kilobytes per second.
Average Bytes: This shows the average size of the sample response in bytes.
Hope, this helps you understand the performance results more better henceforth!
Share you thoughts
To share your thoughts, you can simply fill in the form below and send me an email with your favorite email client/app.