User these days go online for almost everything from getting in touch with friends to finding a job to buying stuff. And with more and more people accessing the web services, performance really becomes a good check point. Nobody likes to click a link and then wait for like ages. In-fact most people stop visiting a site if it takes longer than about 10 seconds to load a page.
So how do we check the performance of the web service(website/web apps)? Well there are a lot of tools available out there for it. One such tool that is also open source is Jmeter.
Now there are already so many tutorials on how to download and set up Jmeter, so you can just go ahead and Google it. So now lets talk about how to use Jmeter the way I do.
- Open Google Chrome browser and go to the web store.
- Now search for an extension - "Blazemeter" and install it.
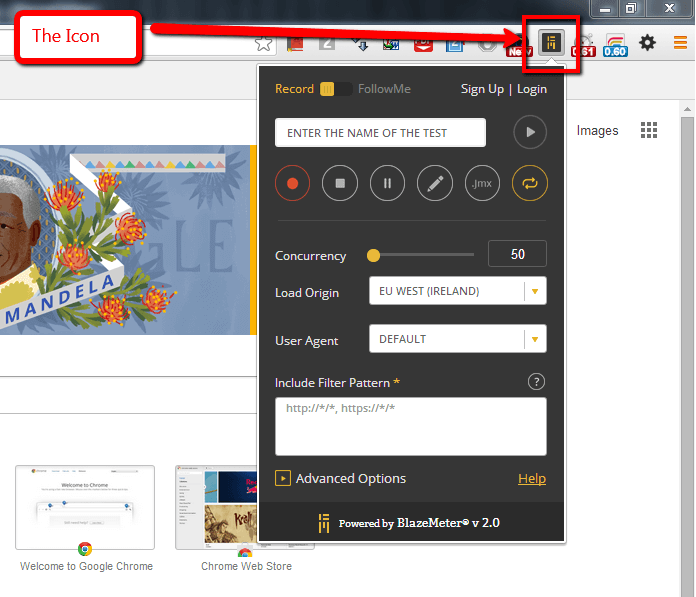
- You will see a black and golden Blazemeter icon beside the address bar in the extensions list as shown in the image below.
- Click on the Blazemeter icon and it will open the Blazemeter performance test recorder panel.
- Note, that you might want to login. The relevance for it is explained in step 11 and 12. So if you do not have a Blazemeter account go ahead and sign up. Its totally free.
- Once you are logged in, click on the Start Record link( a red circle inclosed in red border).
- Now every action you perform in the browser will get recorded.
- Go ahead and open the website you want to check for performance or load.
- Perform all the actions and scenarios you need to test.
- Once you are done, again click on the Blazemeter icon to open the recorder and click on the Stop recording link next to the Record link.
- Now that your test has been recorded, you will want to download it to run it in Jmeter. Now this is why you need to be logged in with the Blazemeter account.
- Now click on the ".jmx" link in the recorder. It will ask you to select the domain that need to be added with the test. Go ahead and select the link and download the ".jmx" file(Considered as test plan in Jmeter).
- Now open Jmeter, and from the file browser open the downloaded jmx file.
- This will list the test plan you recorded using Blazemeter.
- Now you can edit the test plan and the threads(numbers of virtual users).
- Add some listeners to the test plan, run the test and wait for the results. Tada...
Jmeter also has a built in recorder, but there's a difference in how it works and the way tests recorded with Blazemeter work. You see jemter simply takes all the http requests and hit them onto the server all at once. So if you have recorded a test with built in recorder, what it will do if get every individual http request and treat it independently. So when you're testing a web page for a load of 100 users, what it will do is get all the images links and referenced files and make 100 requests for each of them independently. Whereas, Blazemeter groups all the links in a page so that it generates more realistic load since in this case its like 100 users accessing a web page simultaneously rather then accessing individual image or link from that page.
So, that is how I like to do performance testing. I record all my test scripts using Blazemeter's Chrome Extension and then import those scripts in Jmeter and generate the required load.
Share you thoughts
To share your thoughts, you can simply fill in the form below and send me an email with your favorite email client/app.